Everyone needs certain tools to work and get a job finished. Landscapers need mowers and rakes, carpenters need building materials, and software engineers need computers. Therefore, it only makes sense that traders need tools, too, analytical tools to be specific. Especially in today’s highly volatile markets, investors need tools that are continuously analyzing market indices, individual equities and ETFs.
One extremely useful tool is Delphian’s State ModelingTM. State Modeling is our proprietary buy/sell indicator for all market indices, equities and ETFs. For each security, State Modeling provides the trend direction, entry and exit signals, profit & stop-loss targets, average number of days spent in the current trend, and much more.
The stock market has been very sporadic and unpredictable for the fourth quarter of 2018. We have seen many swings higher and many shifts lower. Volatility has increased dramatically and picking a direction has been difficult to say the least. State Modeling has been providing great insights into the direction of the market prior to the large selloff.
There are two indices and four critical dates within our tool that provided the insight to hedge and potentially liquidate some long positions. On September 26, 2018, the Russell 2000 Index (RUT) entered into State 2, a Delphian bearish state. The price of RUT at entry was 1691.62, with the first profit target at 1663.03 and an aggressive profit target of 1646.96. On November 2, 2018, RUT entered into State 8, Delphian’s most bearish state. The price of RUT at entry was 1548.00, with the first profit target at 1491.18. The third and most aggressive profit target was 1331.59. Since the Russell 2000 started this bearish trend in September, it has hit all of its aggressive bearish State Modeling targets, indicating opportunities for significant trade gains.

Figure 1. Tracking the RUT since it transitioned into State 8 on 11/2/2018.
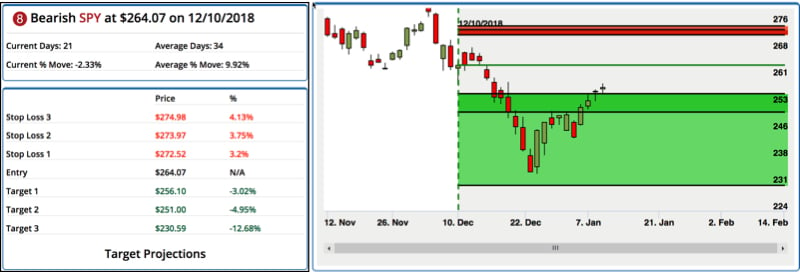
Another key index to track was the S&P 500. The SPDR S&P 500 ETF (SPY) has liquid options that are easy to follow within the Delphian platform. On October 10, 2018, SPY entered into State 2. The price of SPY at entry was 278.27, with the first profit target at 274.57. On December 10, 2018, SPY entered into State 8. The price of SPY at entry was 264.07, with the first profit target at 256.10. The third and most aggressive profit target was 230.59. The third profit target had not been passed as of the writing of this article (12/31/2018) but the low for trading on December 26, 2018, was 233.76 and a new 52 week low.

Figure 2. Tracking the SPY since it transitioned into State 8 on 12/10/2018.
The Russell 2000 seems to be a great leading indicator for the overall market direction. Delphian’s State Modeling first provided bearish market indications for RUT back in September 2018. Using the Delphian platform, with State Modeling and the multi-functional backtesting tools, can provide traders more efficient ways to leverage assets, protect a portfolio, and realize profits in big, unprecedented market swings. Another great aspect of the Delphian trading platform is that State Modeling assists in taking the guess work out of price prediction and more importantly lets the trader take emotion out of trading.
If you’d like to see the platform in action and a demo on how it can help with your specific needs, please let us know.

