Black Swan Event
Dear Traders,
Fact or Fiction?
The S&P continues its grind higher. It is within a few points of our most aggressive target. Fact
The VIX is historically low. It is in State 8 and has reached our aggressive target. Fact
The markets has to go down because it’s overvalued. Fiction- Markets can go up and down without “proper reasoning.”
As you know at Key2Options, we deal with mathematics and do not listen to headlines as we believe that the prices are reflected in the underlying price. While we our reaching our targets in most of our major averages, the market can defy the “normal” ranges it typically trades in. So if you tell me the market goes past our aggressive targets, I would not be shocked. We deal in averages, and the averages are saying it’s time to look to get defensive if not short.
When we trade, we look at what we know and try to use statistics to take measured guesses on where the underlying will move. There are movement though go outside the normal standard deviations we look at typically. What if we had a 5 sigma move, or even a 17 sigma move?
First, what is sigma? In statistics and probability, the lower case Greek letter sigma is used to denote the standard deviation of a distribution, which as the name implies, is the accepted unit to measure how much an outcome can vary from its mean or average. A Wikipedia article lists the following table for the likelihood of sigma deviations for the standard normal distribution
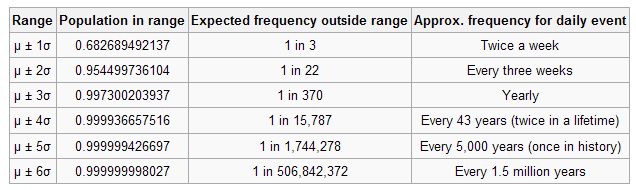
Is there a Black Swan event coming soon? A black swan event is an occurrence that deviates beyond what is normally expected of a situation and is extremely difficult to predict; the term was popularized by Nassim Nicholas Taleb, a finance professor.
On Monday, October 19th, 1987 we suffered a 22.6% drop in the Dow Jones. This was a 17 standard deviation move. The chances of these events happening are slim but they do occur.
Let me pose 3 possible Black swan events that could cause a greater move to the downside than what we have seen in the past.
- We are in a Presidential race in the United States. It’s no secret that both domestically and abroad there is animosity towards the United States government, as well as, for both Hillary Clinton and Donald Trump. What if one or both candidates were assassinated? It has been 53 years since JFK was shot and killed. A 4 sigma move would suggest this happens every 43 years.
- The opening day for American football Season is on September 11th, 2016. We all know what happened on that day in history. A targeted attack on multiple stadiums with drone bombs is possible.
- The outstanding global derivatives market is over $700 trillion — 10 times global GDP. One bank, Deutsche Bank, owns about $75 trillion of those derivatives. That’s roughly 13% of all outstanding global derivatives. Consider that Lehman Bros. was leveraged 31-to-1 before its 2008 collapse. Deutsche Bank is now leveraged over 40-to-1.
This is not in any way to suggest any of these events will happen. It is highly improbable. The market, however, is historically overvalued based on a Price Earnings ratio.
Options gives us a great way to hedge our portfolios. This might be a good time to take a look at your portfolio in the event of a Black Swan event!